Now that your treatment center is collecting outcomes data, are you using it to guide your decision making? You can learn a lot by comparing your aggregated results across locations, between clinicians and over time. But perhaps the biggest learning comes from comparing your outcomes to those of treatment centers similar to yours.
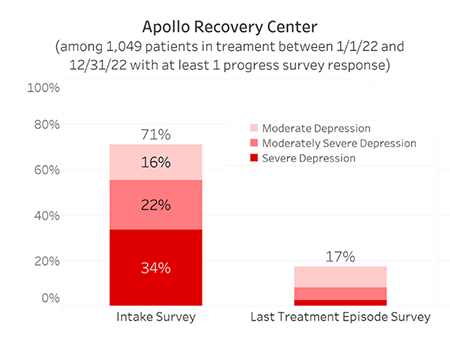
The truth is that most center’s results look quite good in the absolute. You may find, for example, that the percentage of your patients experiencing moderate to severe symptoms of depression decreases from 71% at the start of treatment to 17% on their last survey before they leave treatment:

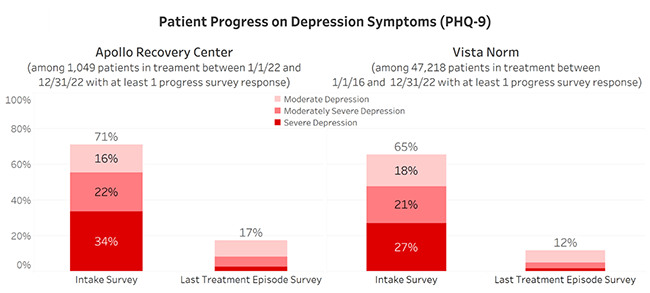
It looks like your team is doing an excellent job treating their patients’ depression. You wouldn’t think there’s a lot of room for improvement there, right? But if you take a minute to compare your results to those of similar treatment centers, you’ll discover two things: (a) a higher percentage of your patients are entering treatment reporting moderate to severe depression than is typical of other centers like yours; and (b) other centers are able to decrease the percentage of patients experiencing moderate to severe depression to 12% prior to discharge, which is 5 percentage points lower than your 17%:

Hmm. Perhaps this is an area your team could further improve upon. And assuming you are able to do so, this could even be an area worth highlighting in your marketing (e.g., “one of our specialties is successfully treating patients with high depression symptoms”).
Having a clear understanding of the areas in which your center’s performance is below average as well as information on how your patients differ from the norm should make it relatively easy to choose the best performance improvement goals to focus on.
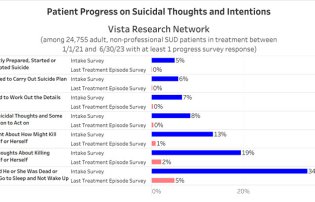
To help you do this, Vista is publishing our norms for three types of centers – adult SUD centers, adolescent SUD centers, and adult behavioral centers. In each of the three sets of during-treatment norms, there are about 35 charts covering everything from basic demographic and primary drug of choice info to average co-occurring disorder improvements and treatment completion data. We are also publishing sets of ~25 separate one year post-treatment outcomes graphs covering 15,603 adult SUD patients and 1,045 adult behavioral patients.
You can download the norms that apply to your center here:
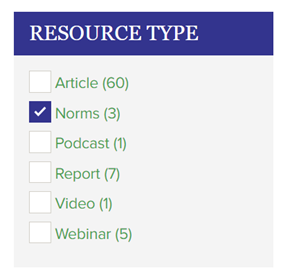
We will update the norms on our website on a regular basis. To get the latest, click on Knowledge Hub and select the Norms Resource Type:

I hope you find these helpful, and don’t hesitate to reach out if you have any questions!
P.S. Struggling to create the Improvement in Depression Symptoms chart above from a large spreadsheet of PHQ-9 scores? This video shows you how.


