

Your team has been talking about doing outcomes research for years. But every time it has come up, the decision was pushed down the road – “next quarter we’ll look into it”.
Until now. Perhaps your biggest payer turned down the reimbursement rate increase you desperately need. Or one of your patients committed suicide, and your post-event review determined that her clinician might have been able to save the patient's life if he had been alerted to how she was feeling.
For whatever reason, you’ve realized that monitoring your patient’s progress and proving how effective your treatment truly is can’t wait any longer. So how do you choose the right outcomes research system for your needs?
Your first step is to prioritize the most important benefits you want outcomes research to provide. To do this, it’s helpful to consider the during-treatment monitoring of your patients separately from following up with your patients after treatment.
Key Benefits of Monitoring Patients During Treatment
Done right, progress monitoring (also called measurement-based care) delivers multiple benefits:
| Benefit | Requires |
|---|---|
| Identify patients not progressing well in time to make appropriate treatment plan changes | Easy-to-understand graphs of key metrics showing trends over time |
| Immediately identify patients in trouble | Clinician alerts when patients report dangerous thoughts and/or behaviors |
| Identify performance improvement opportunities | Easily compare aggregated results by program, by clinician, and over time, and benchmark against norms |
| Prove how much your patients get better during treatment | Easily compare patient metrics at the start of treatment to those at the end of treatment |
Centers who are simply interested in “checking the boxes” often start out by asking patients to take a few surveys through an app, the center’s EMR or on paper. While this can provide some data to show the Joint Commission, the amount of effort required to summarize these surveys into useful trend graphs and aggregated metrics makes it highly unlikely your center will be use your data for performance improvement or payer negotiations:
DIY Surveys | An App | Your EMR | Research Co. | |
|---|---|---|---|---|
| Identify patients not progressing well | Requires staff effort | Varies | Varies |
|
| Alerts for dangerous thoughts/behaviors | Requires staff to notice | Unlikely | Unlikely |
|
| Identify performance improvement opportunities | Requires extensive staff effort | Highly Unlikely | Highly Unlikely |
|
| Showcase patient improvement during treatment | Requires extensive staff effort | Highly Unlikely | Highly Unlikely |
|
To consistently provide updated trend data to your clinicians prior to therapy sessions as well as useful performance improvement information to your managers, partnering with an outcomes research company is the way to go.
Comparing Outcomes Research Company’s Progress Monitoring Platforms
There are three primary outcomes research companies providing progress monitoring services to addiction treatment centers across the U.S. Each is quite different:
| ERPHealth | Trac9 | Vista Research Group | |
|---|---|---|---|
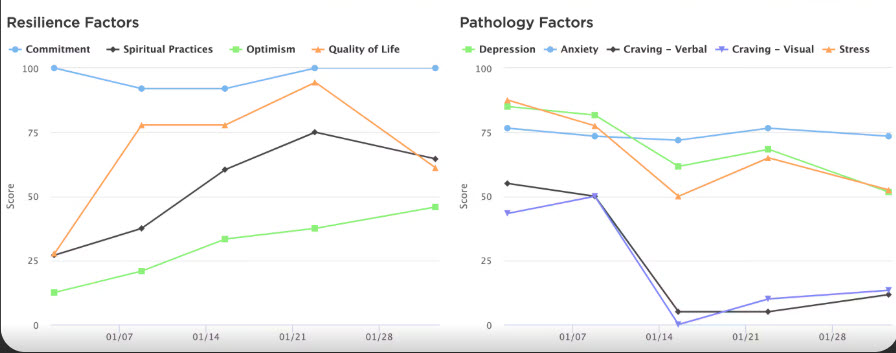
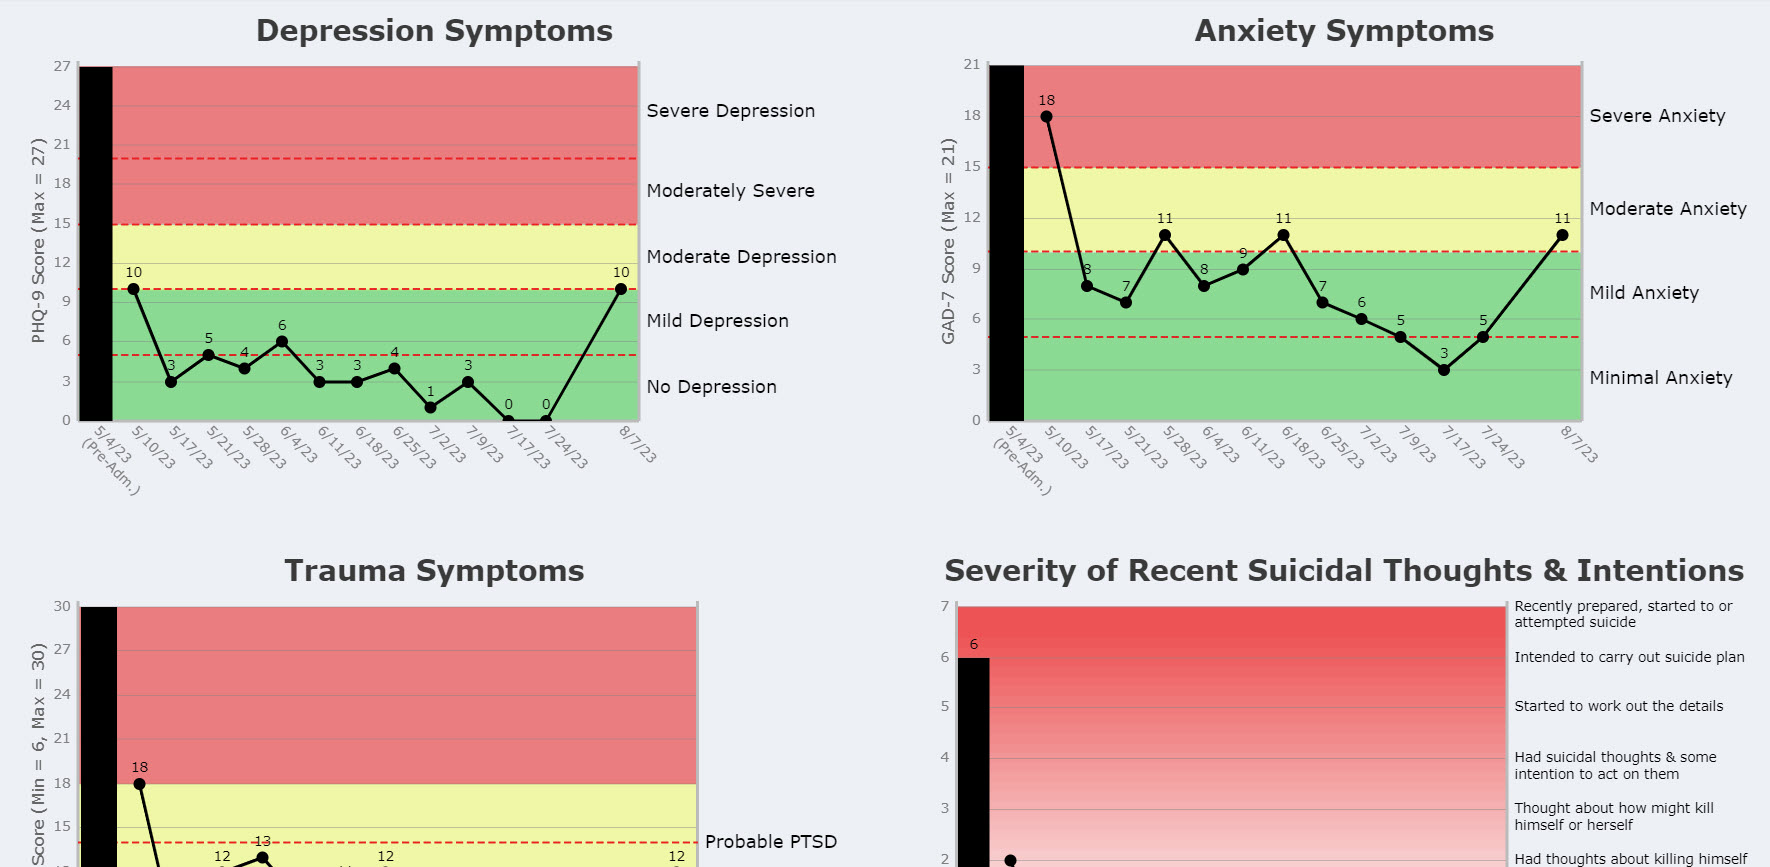
| Primary Assessment | Holistic Hexagon, PHQ-9 (depression), GAD-7 (anxiety), Perceived Stress Scale (PSS) | Global Recovery Scale covering 9 core domains: Anxiety (Penn State Worry Questionnaire), Depression (CES-D), Stress (Perceived Stress Scale), Verbal Craving, Visual Craving, Commitment to Sobriety Scale, Optimism, Quality of Life in Addiction Recovery, and Spirituality. | All patients are assessed regularly for suicidality, cravings, therapeutic alliance & satisfaction with treatment. Patients who screen positively for a co-occurring disorder also take the relevant assessment(s): PHQ-9 (depression), GAD-7 (anxiety), PCL-6 (PTSD), EDDS (eating disorders), ASRM (mania), Yale PRIME Rev. (psychosis). |
| Optional Assessments | Additional Options | Additional Options | Additional Options |
| Patient Dashboard (click to enlarge) | 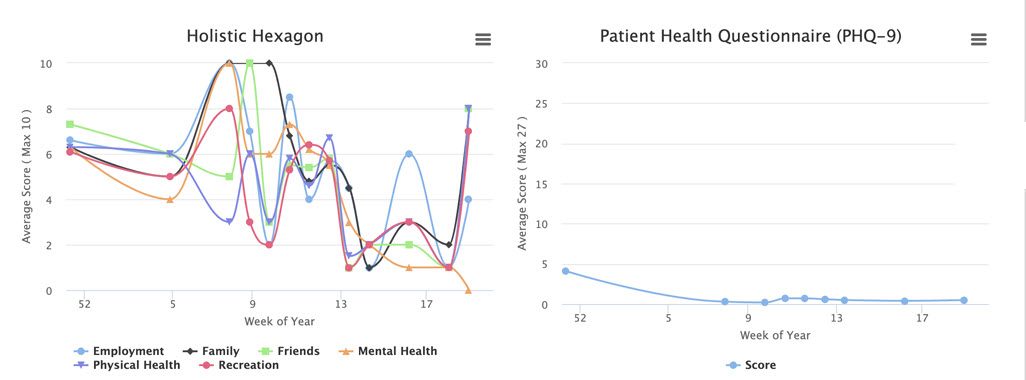
| 
| 
|
| Data Analytics | Limited | Limited | Data analytics platform analyzes 76 aggregated patient metrics by program, payer, clinician, time period and other factors |
| Reporting | Very Basic | Very Basic | Annual Treatment Effectiveness Report compares results to norms and trends over time and analyzes metrics by program and by clinician |
| Pricing | Not Published | Not Published |
As different as their progress monitoring platforms are, by far the most important difference between the different outcomes research options is how they handle post-treatment outcomes research.
Comparing Post-Treatment
Outcomes Research Options
The most important question to ask when you’re considering different options for following up with patients after treatment is simple: What percentage of patients will each option reach after treatment?
The vast majority of centers that use an app, their EMR or their internal staff to follow up with patients after treatment are only able to reach a very small percentage of their patients six months or a year after treatment. Human nature being what it is, these early responders are far more likely to be doing well than those who do not respond. Pretending that these early responders are representative of all the patients is how treatment centers make ridiculous claims that 80% or more of their patients are in recovery one year after treatment.
In fact, the only accurate way to measure treatment success is by assuming that patients who don’t respond are not in recovery. This means that for a treatment center to be able to report a high success rate, they need to be able to get a high percentage of their patients to respond to their surveys.
Former addiction treatment patients are notoriously difficult to reach. Not only will many of them be ashamed of having relapsed, but discharging patients are often told to change their phone numbers so their dealer can’t contact them. Getting a high percentage of patients to respond requires reaching out multiple times in multiple ways, and incentivizing them to respond. Here are how the different ways to do outcomes research line up:
| An App | Your EMR | DIY Team Outreach | ERPHealth | Trac9 | Vista Research Group | |
|---|---|---|---|---|---|---|
| Emails Patient | No | Yes | Yes | No | Yes | Yes |
| Texts or Push Notifs. | Yes | Possibly | Possibly | Yes | Yes | Yes |
| Calls Patient | No | No | Yes | No | No | Yes |
| Pays Patient | Unlikely | Unlikely | Unlikely | Not Published | Optional | Yes |
| Calls Locator People | No | No | Possibly | No | No | Yes |
| No. of Contact Attempts | Several | Several | A Few | Not Published | Not Published | 10-15 |
| Est. One Year Response Rate | < 5% | < 10% | < 20% | Not Published | Not Published | 44.3% |
Of all the outcomes research companies, only Vista publishes historical response rates. Since 2016, Vista has been able to contact 56% of SUD patients one month after treatment, 48% six months after, and 44% one year after discharging from treatment:
% of SUD Patients Vista Reached
(among patients who discharged 3/1/16-6/30/25 after at least 7 days of treatment)
| One Month | Six Months | Twelve Months | |
| Outcomes Research Patients | 43,527 | 37,543 | 31,283 |
| Number of Respondents | 24,227 | 17,961 | 13,851 |
| % of Patients Reached | 55.7% | 47.8% | 44.3% |
While Vista's average one year response rate is 44.3%, there's a tremendous variation in response rates by treatment center. For many of the best treatment centers, Vista is able to reach 55% to 60% of the patients one year after discharge.
Since Vista is uniquely able to reach such a high percentage of patients after treatment, it is not surprisingly that it is the only outcomes research company that offers multiple comprehensive outcomes research reports free of charge to its clients:
An App | Your EMR | DIY Team Outreach | ERPHealth | Trac9 | Vista Research Group | |
|---|---|---|---|---|---|---|
| Reports | None | None | None | Not Published | Not Published | All included: Annual Post-Treatment Outcomes Report; Payer Summary Report; Prospective Patient Report |
| Pricing | Varies | Bult into EMR Cost | Staff Time | Not Published | Not Published | $120 per patient to follow up 3 times in post-treatment year (at one, six & twelve months) |
Choosing the Best Outcomes Research For Your Treatment Center
Now that you’re finally ready to monitor your patients during and after treatment, make sure the system you choose meets all of your needs. Ask yourself:
Will it give your clinicians useful, real-time information about how each patient is progressing, including an alert if a patient starts seriously contemplating suicide?
Will it reach enough patients after treatment to prove how well your treatment works?
Will payers, prospective patients and grant funders believe the data?
Will it help you keep improving the care you provide?
If the answer to any of these is no, keep looking. Your patients, and your center, deserve a system that delivers all four.